A Digital Recipe for Annotating and Visualising Museum Collections Data
Author(s): Sarah Middle and Elton Barker
10/03/2025In our last post , we explained the motivation behind our OSC and introduced some of the digital tools and techniques we’d be using to help cultural heritage professionals leverage their collections data to facilitate storytelling to the wider public. We’ll now provide more detail on how we carried out our pilot study and share some of the outputs we have produced.
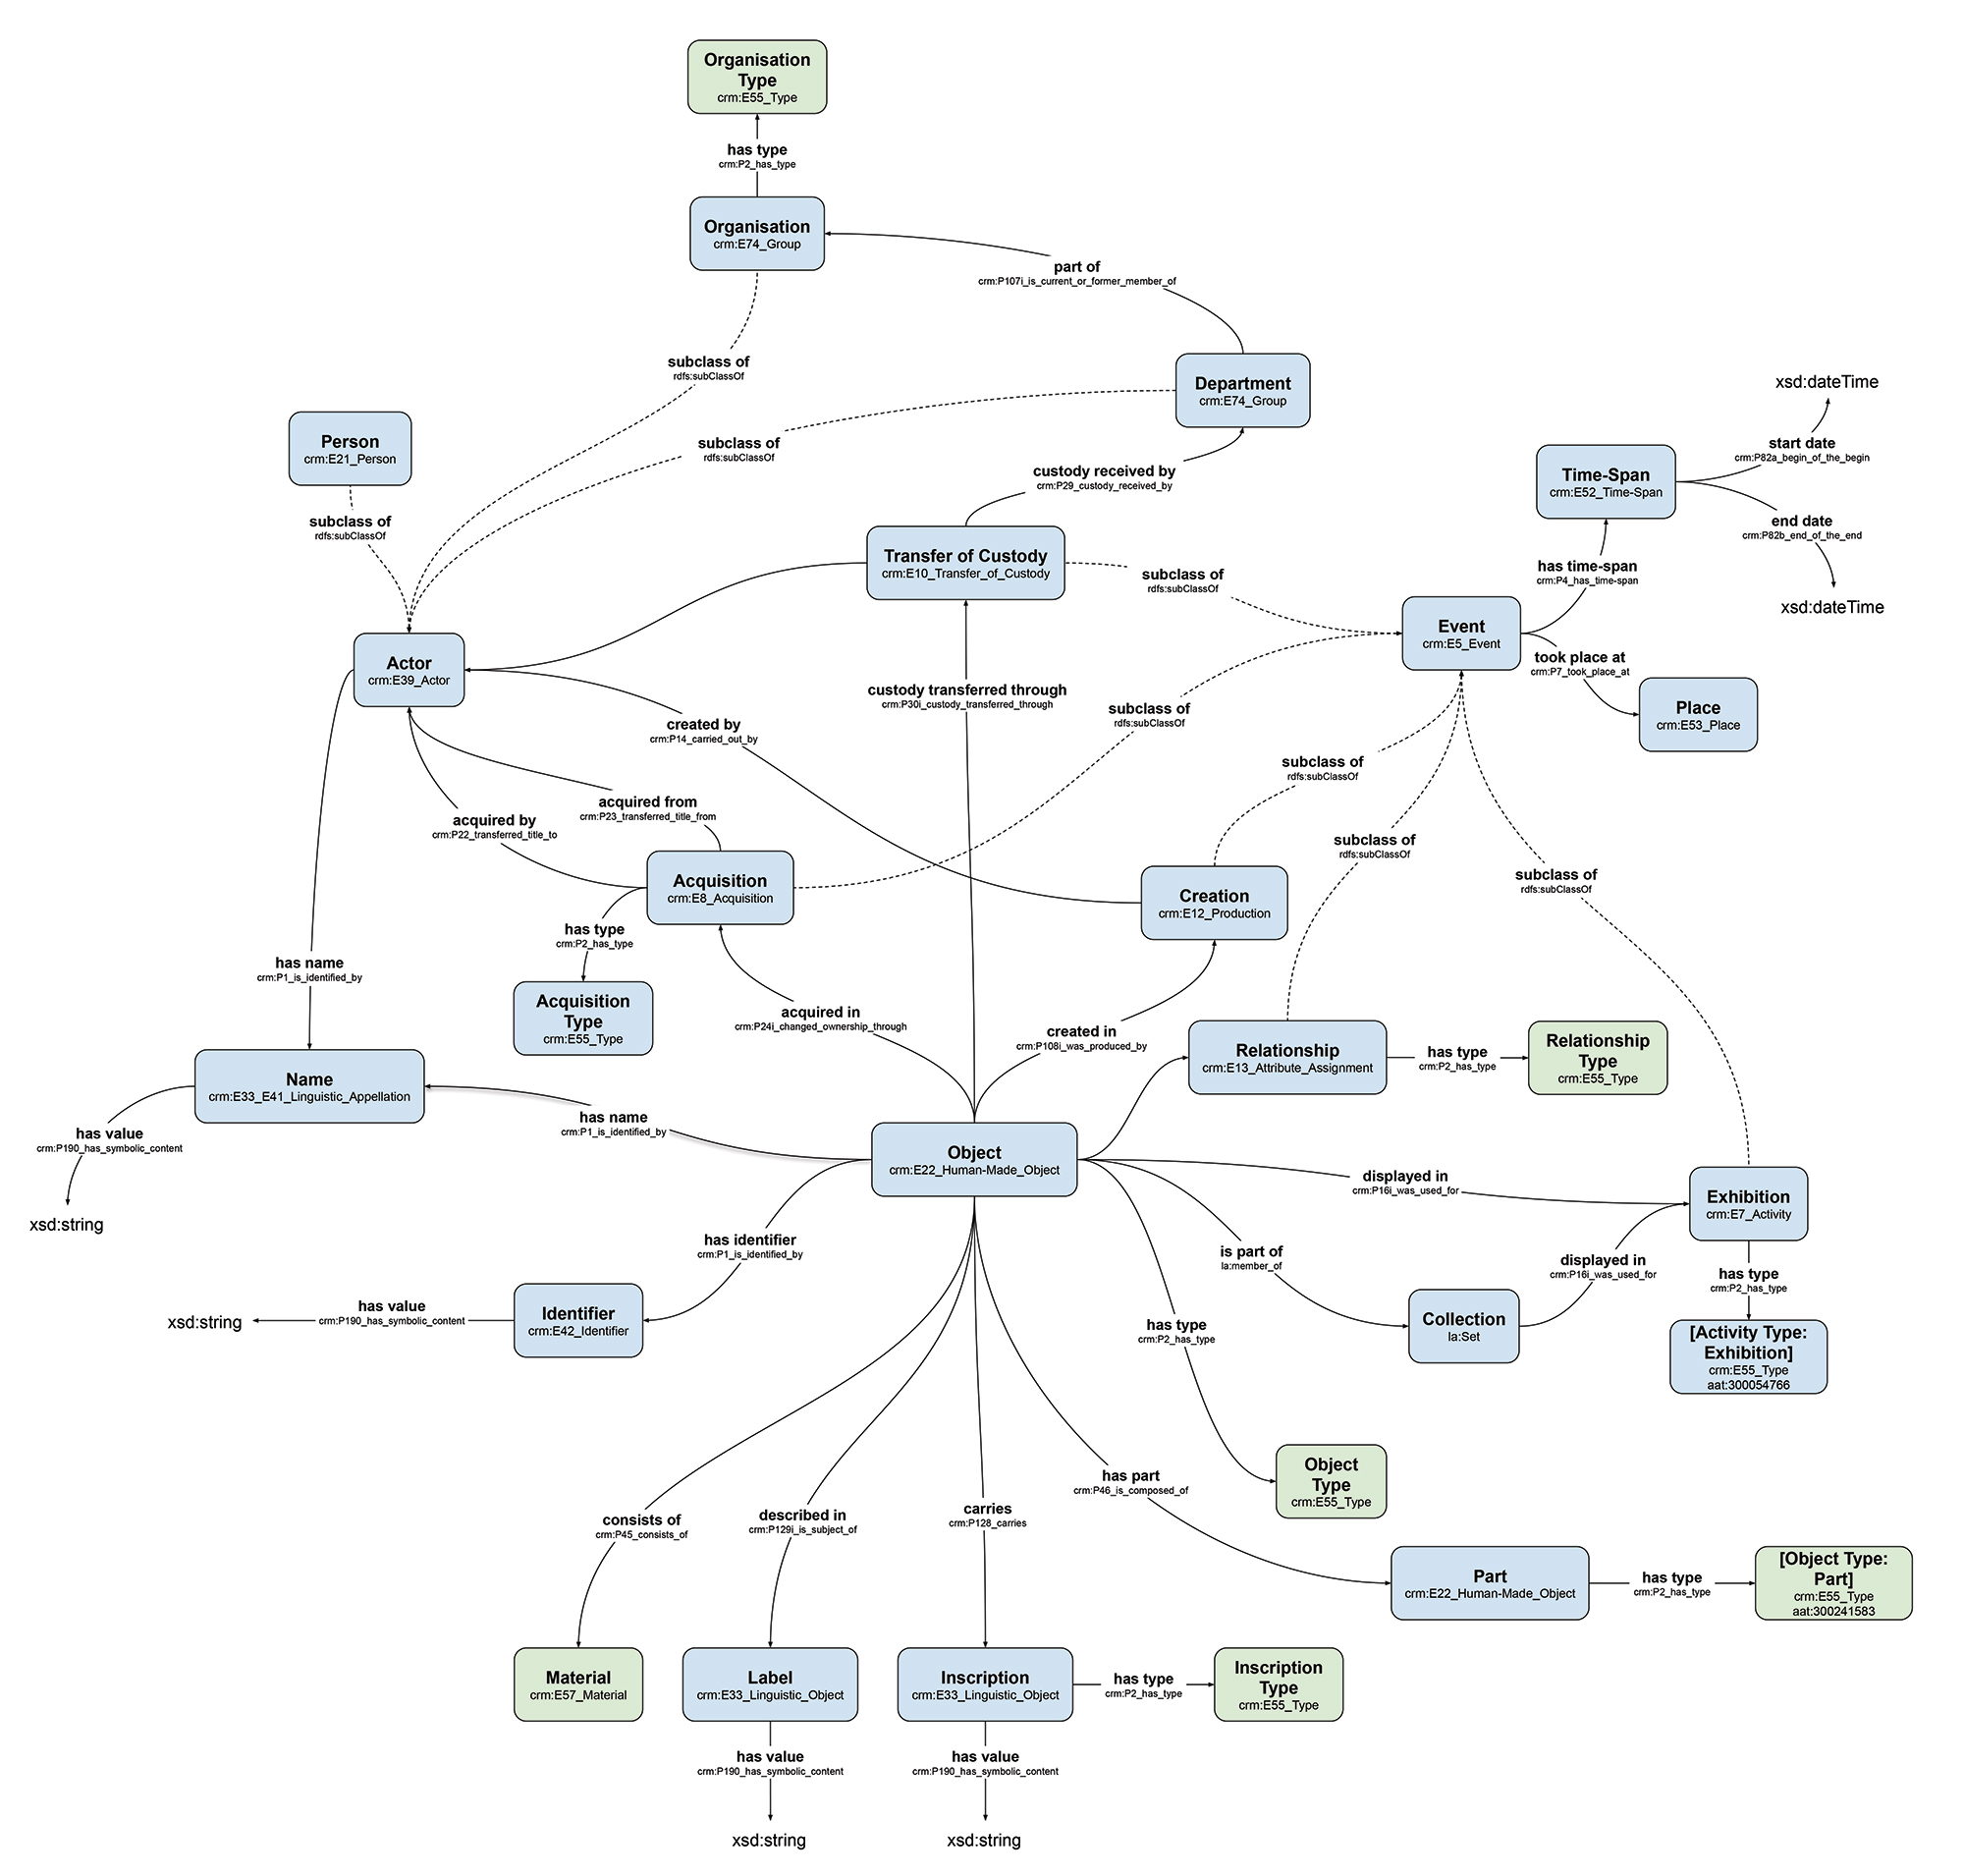
We started by taking a closer look at the types of information that could be found in our dataset, a sample of catalogue records for 19th and early 20th century navigational instruments at National Museums Scotland. As well as identifying the various elements which could be usefully extracted from the records for these instruments — entities such as place, time and people — we also thought about how the relationships between them might be defined. In doing so, we built a data model from the object descriptions themselves, which would allow the discovery and use of the entities mentioned, as well as provide an indication of their connection to each other.

Image: data model built from the object descriptions
Of course, we aren’t the first people to think about what a data model for museum objects might look like. Therefore, once we had an idea of the elements to include in our data model, we also thought about how we might align our work with existing resources. Using an established data model (either fully or partially) means that the data it describes can be integrated with related digital resources much more easily than developing a new, bespoke, data model for each project. Due to the nature of our data, we decided to use the Linked Art model to describe the entities and relations, with a few bespoke additions of our own for any elements not currently included (such as usage, expedition, and voyage). Alongside a formal definition of our data model, we produced an ‘Annotation Protocol’ to describe how we used this model as the basis for annotating our data in Recogito Studio.
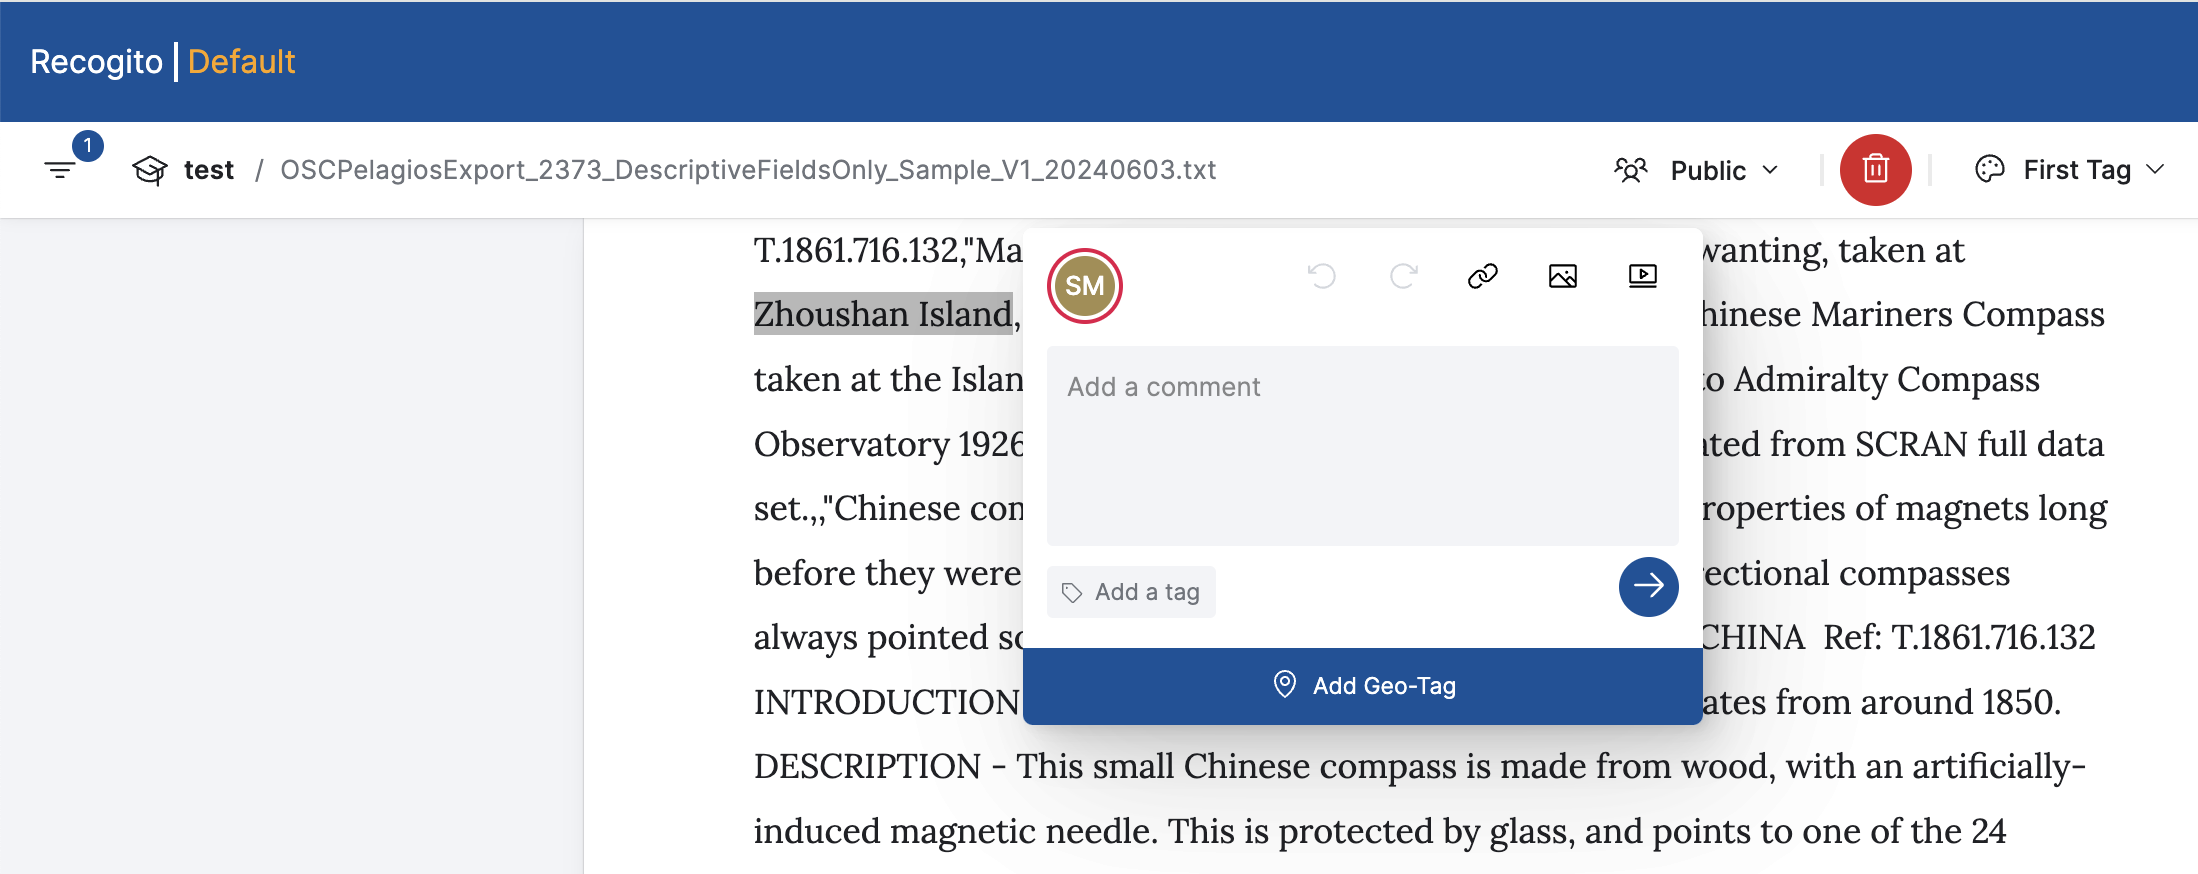
Annotation in Recogito Studio is a simple, intuitive process that can be used to surface rich information from within a text document. Its appearance is similar to that of standard online word processing platforms and it allows multiple users to collaborate on a single document or project. The annotations themselves can take the form of comments (including text, hyperlinks, images, or video), or descriptive tags defined by the user. Additionally, with the Geo-Tagger plugin developed for our OSC, we were able to link each annotated place name to a digital resource that describes that place; in our case we used Wikidata. This has the advantage of bringing location information into the annotation, which can be used to produce a map visualisation.

Image: with the Geo-Tagger plugin we were able to link each annotated place name to a digital resource that describes that place.
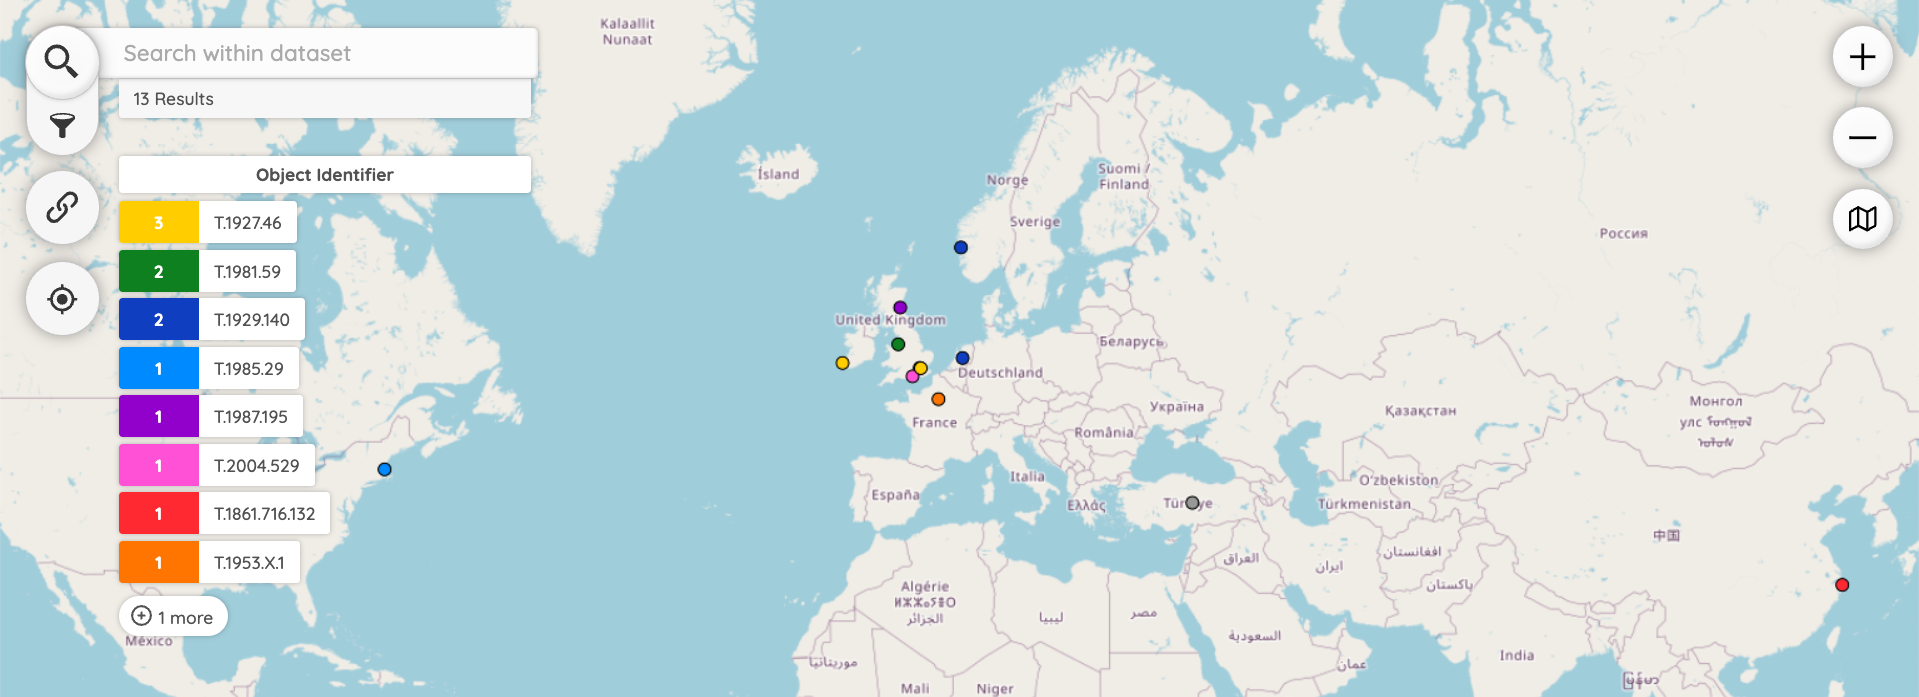
While Recogito Studio comes with its own basic map visualisation, we wanted to create a more dynamic and explorable resource that other people could easily use. Given the strong geographical aspect of our data, we decided to use Peripleo, which is a free map application, available via GitHub and accompanied by an easy to follow tutorial. The geographic data we exported from Recogito Studio (in GeoJSON format) required some minor alterations to be compatible with Peripleo; once this issue was resolved, we were easily able to visualise our data. However, as only the place-related data was provided in the geographic export (i.e. not our other annotations relating to the same museum objects), we manually updated the data underlying the Peripleo visualisation to include key information such as object numbers and links to the catalogue records on the National Museums Scotland website.

Image: we used Peripleo to visualise our data
Overall, we found the process of annotating and visualising the NMS data to be clear and straightforward, which should be assisted further by the descriptions of the different components of our pilot study incorporated in the annotation protocol that forms part of our ORDO dataset, as well as our recent article published in the Journal of Open Humanities Data. There were, however, some issues that we identified with both the software and our workflows, including:
- Enhancement (how we might ensure a richer data export from Recogito Studio to provide more informative visualisations)
- Scalability (how our processes might be automated for use on larger datasets)
- Interoperability (how we might use our exports from Recogito Studio to produce data that can be more readily linked to other resources)
We’ll explain more about these issues (and their possible solutions) in our next post. In the meantime, please visit our Challenge webpage to find out more about our project.

